explainalizer
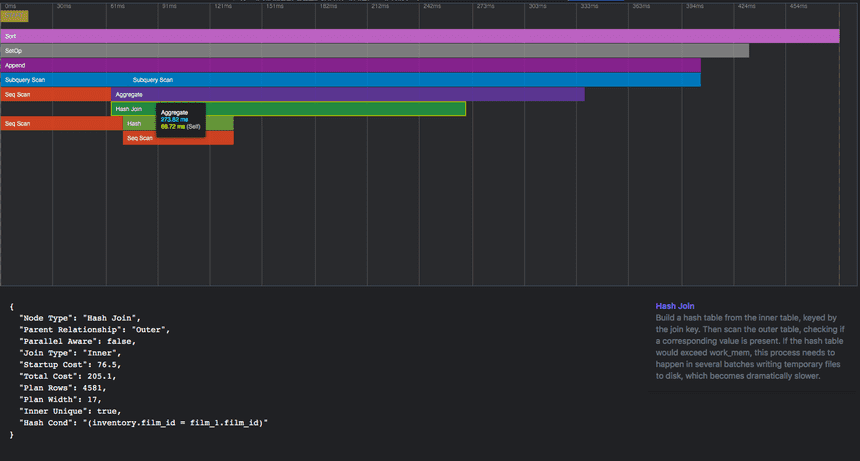
This is a Proof of concept (PoC), of a visualizer for profiling and debugging the performance of queries on a PostgreSQL database. I got the inspiration from the way you can plot flamecharts of the CPU usage on the Chrome DevTools.
Try it live
victornpb.github.io/explainalizer/
TODO:
- Flame chart
- Node inspection
- Type information
- Shareable URL (compress the JSON)
- User interface for inputing the JSON, with instructions, etc...
- JSON highlighting, with folding
- Filtering, and Legend
- Bottom Up chart
